A selection of projects demonstrating my experience in business intelligence, data integration, data preparation, and analytics. I use tools such as Power BI, SQL, Excel, and Microsoft Fabric to transform data into reporting that supports business understanding and decision-making.
01.
Short-term Rental Analytics
Business Problem
Short-term rental owners and property managers need a clear view of portfolio performance to understand which properties are performing well and where improvements may be needed. Booking, expense, property, and pricing data can be spread across different sources, making it difficult to evaluate revenue, occupancy, and profitability consistently.
Project Objective
Develop a business intelligence solution that consolidates short-term rental data and provides reporting to evaluate property and portfolio performance, identify areas requiring attention, and explore pricing opportunities.
Approach
- Combined booking, property, owner, expense, and pricing data into an analytical reporting dataset.
- Implemented Microsoft Fabric Bronze and Silver data preparation workflows.
- Applied data validation to identify duplicate, missing, and invalid booking records.
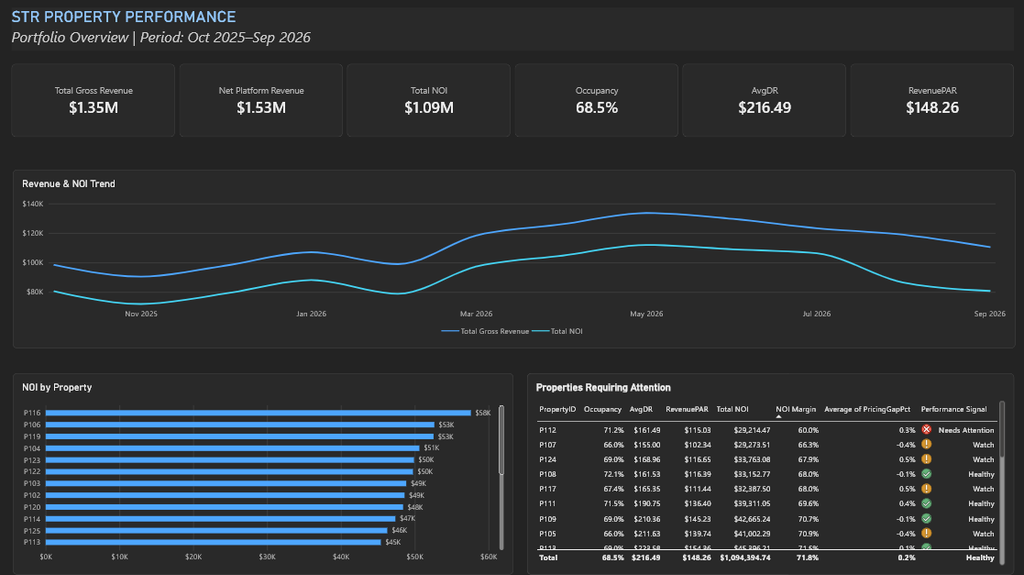
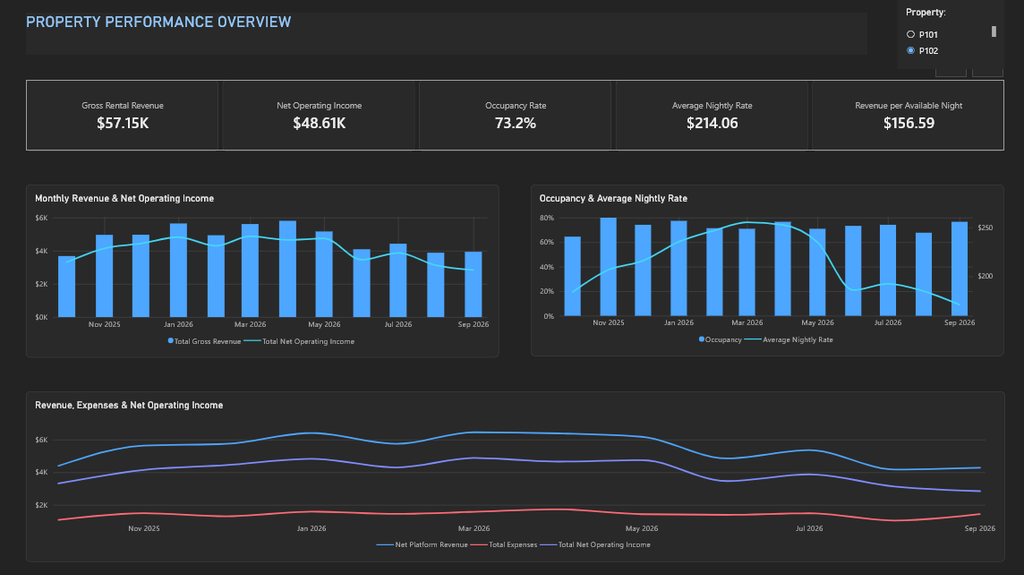
- Developed Power BI dashboards to analyze revenue, occupancy, expenses, net operating income, property performance, and pricing comparisons.
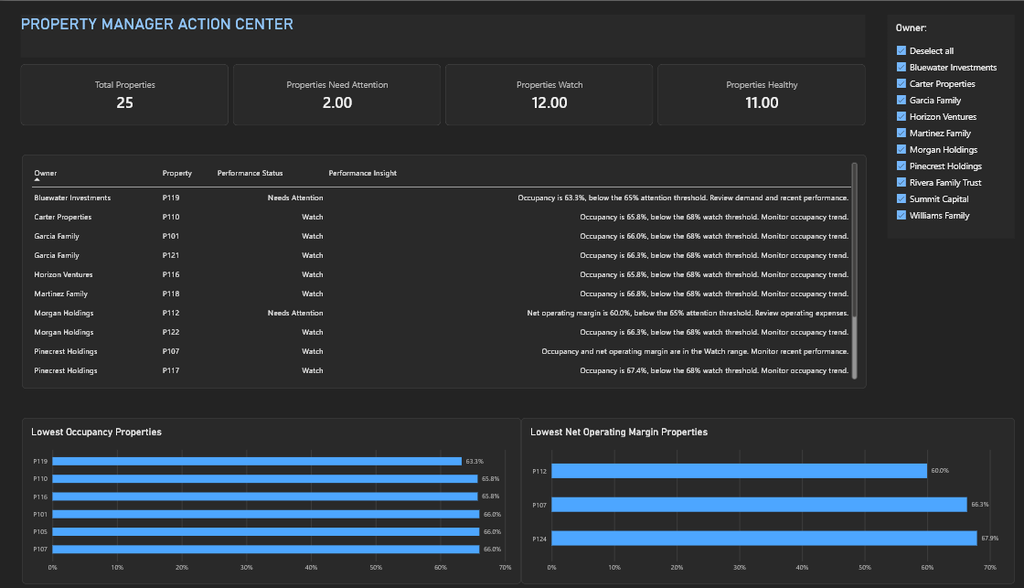
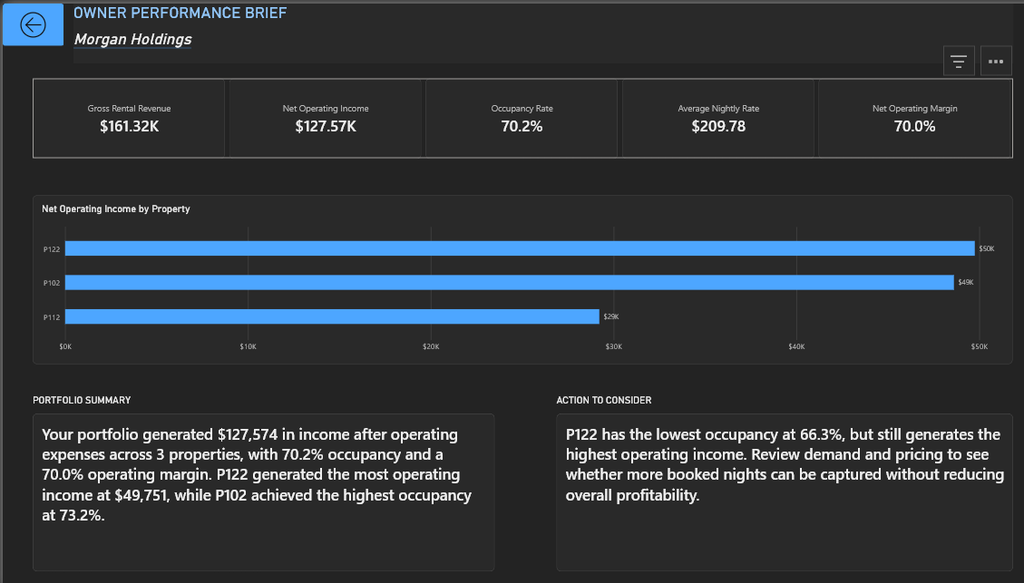
- Created portfolio, property manager, and owner-level views to support different perspectives on performance.
Key Insights & Business Value
The dashboards provide visibility into property-level and portfolio-level performance, helping users identify properties with lower occupancy or operating margins and compare performance across owners.
The reporting supports further investigation into potential operational improvements and pricing opportunities. It provides a structured basis for property managers to prioritize properties that may require attention.
Tools: Microsoft Fabric · Lakehouse · Data Factory Pipelines · Power BI · DAX · Data Modeling
02.
Restaurant Sales Analytics
Business Problem
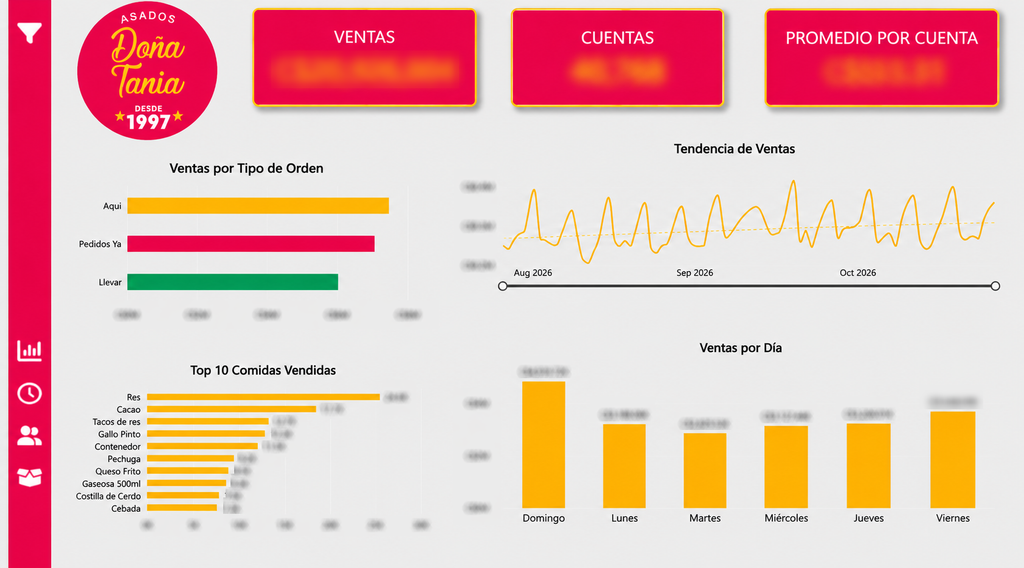
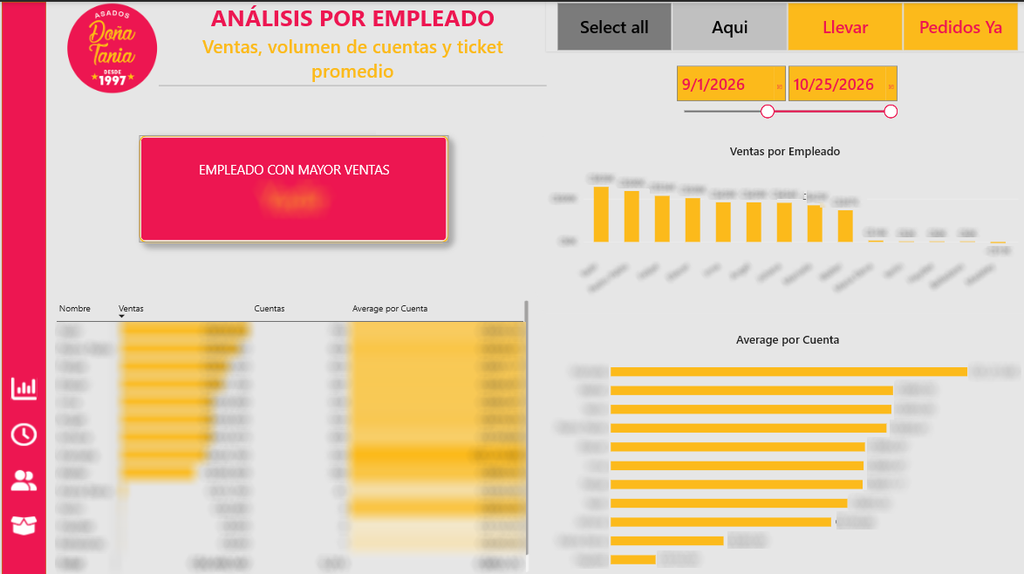
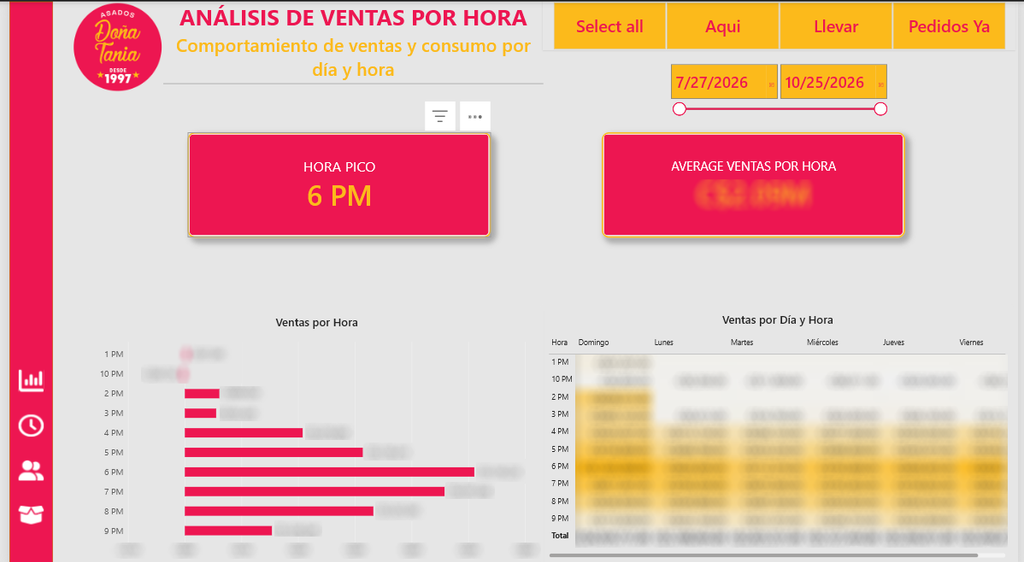
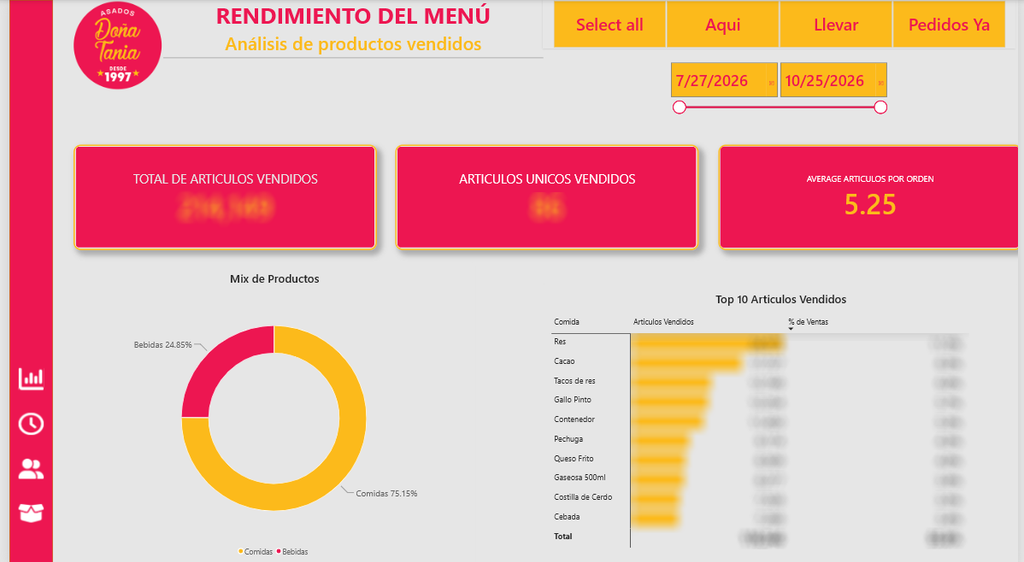
Restaurant management needs reliable reporting to understand sales performance, menu-item demand, order patterns, and employee activity. Without consolidated analysis of point-of-sale data, it can be difficult to identify sales trends, peak periods, and differences in product or operational performance.
Project Objective
Develop an operational reporting solution using Oracle MICROS 3700 point-of-sale data to support analysis of sales, menu performance, employee metrics, and historical business activity.
Approach
- Extracted transactional data from the Oracle MICROS 3700 database using SQL Anywhere.
- Prepared, transformed, and validated data for analysis and reporting.
- Maintained a star-schema data model to support reporting and analysis.
- Developed Power BI dashboards to explore sales by order type, menu item, category, employee, day, and hour.
- Created interactive views to support analysis across selected dates and operational dimensions.
Key Insights & Business Value
The dashboards provide management with visibility into sales patterns, popular menu items, employee sales activity, and hourly performance.
This reporting can help identify high-demand periods, understand menu performance, and inform further investigation into staffing, product mix, and operational decisions.
Tools: Oracle MICROS 3700 · SQL Anywhere · Excel · Power Query · Power BI · DAX
03.
S&P 500 Investment & Risk Analysis
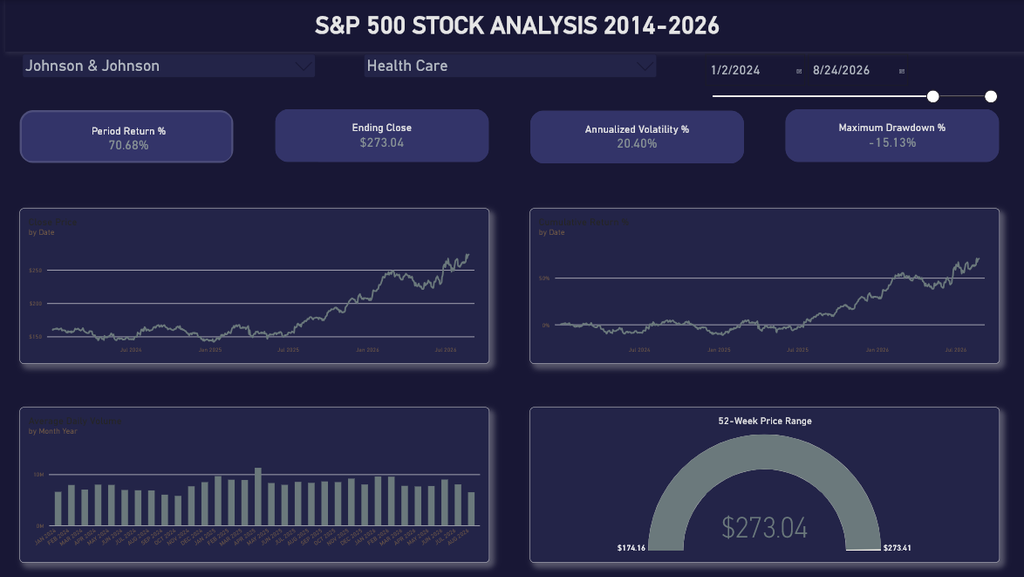
A personal Power BI project exploring historical S&P 500 stock performance and investment risk. The report analyzes price trends, period returns, volatility, and drawdowns across selected stocks and date ranges.
Business Problem
Comparing investment performance using stock prices alone does not provide a complete picture of risk. Investors also need to understand returns over consistent periods, price variability, and potential downside exposure when comparing individual stocks and market sectors.
Project Objective
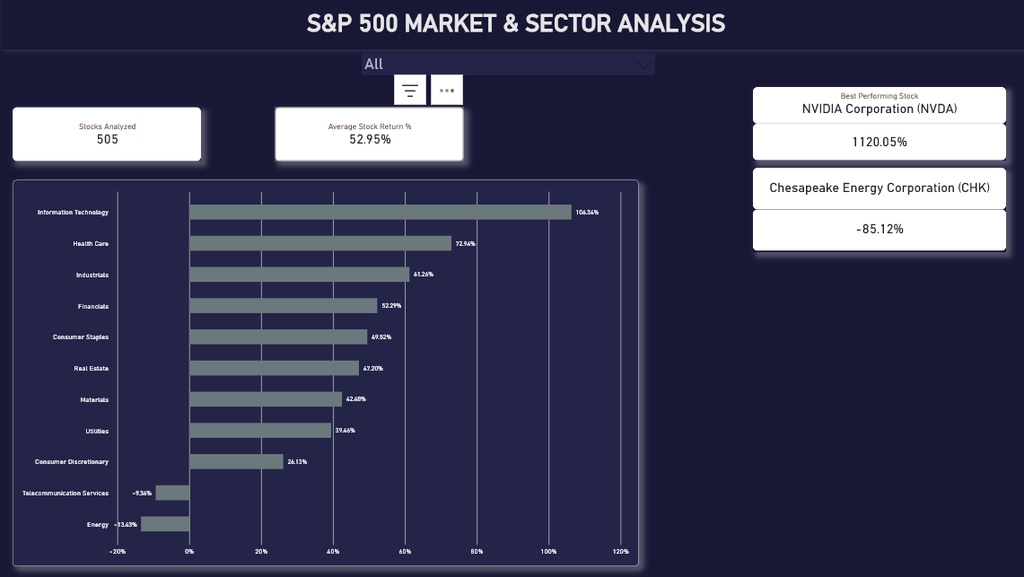
Build an interactive Power BI report to analyze historical S&P 500 stock performance and explore investment risk across selected stocks, sectors, and date ranges.
Approach
- Built a data model combining historical stock prices, stock information, and a calendar table.
- Developed DAX measures to calculate period returns and compare performance across selected dates.
- Analyzed daily and annualized volatility to evaluate price variability.
- Implemented running peak and drawdown calculations to examine downside risk.
- Implemented running peak and drawdown calculations to examine downside risk.
- Designed interactive analysis using stock and date selections.
Key Insights & Business Value
The report enables users to compare historical returns, volatility, and drawdowns across stocks and sectors.
By presenting performance and risk measures together, the analysis provides a more complete perspective on historical investment behavior and supports informed comparisons. It is an analytical project, not investment advice or a prediction of future performance.
Tools: Power BI · DAX · Data Modeling